UW GIS Project
Neurocritical Outcomes
Project for University of Washington (Professional and Continuing Education Department) Certificate in Geographic Information Systems
-
Project Overview
Using properly anonymized data on patient transport and outcomes, we sought to map out transport times to Harborview and then correlate outcomes for patients with Neurocritical trauma. We did not have accurate information on patient travel times, just methods, so we thought to construct our own network maps to calculate transit times.
-
Understanding the problem
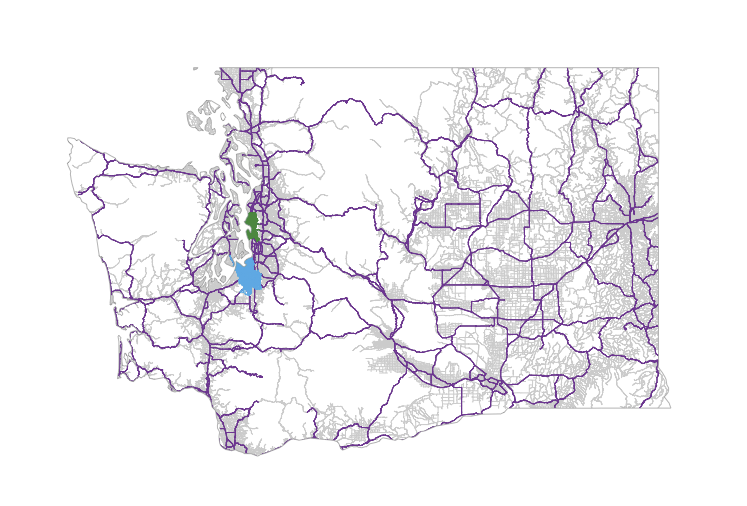
The project required our team to first map the transit times to Harboriew Medical Center by land and air. We quickly determined we lacked all the data we needed on speed limits as the colors show the only roads we had the data for.
-
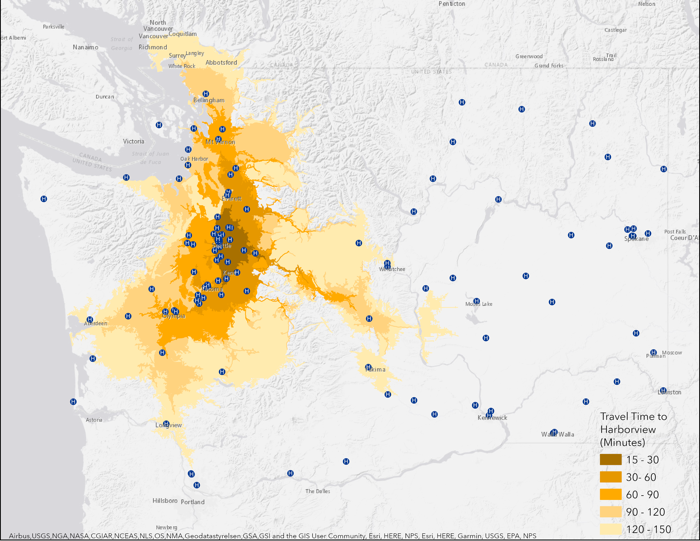
Finding the right tools
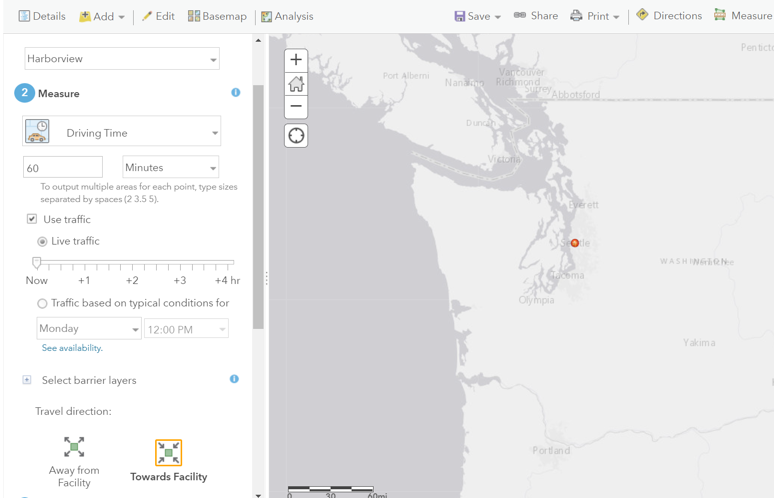
After some digging, we discovered the right analysis tool on Arcgis.com. With our student credits we generated maps of all the drive times from Harborview in increments of 30 minutes.
-
Automating layer creation.
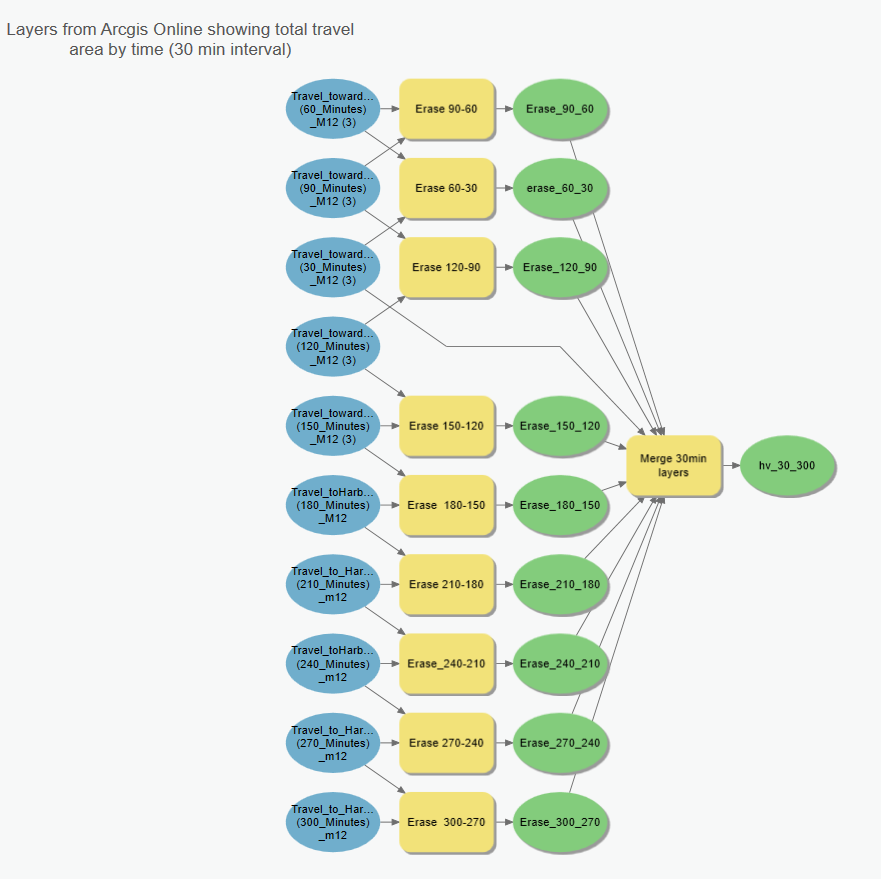
The output of our online analysis tool showed total areas that could be reached within a certain amount of time (and with specific driving conditions). To make this more visually appealing, we automated the process of isolating bands of time, creating service areas (or isochrones)
-
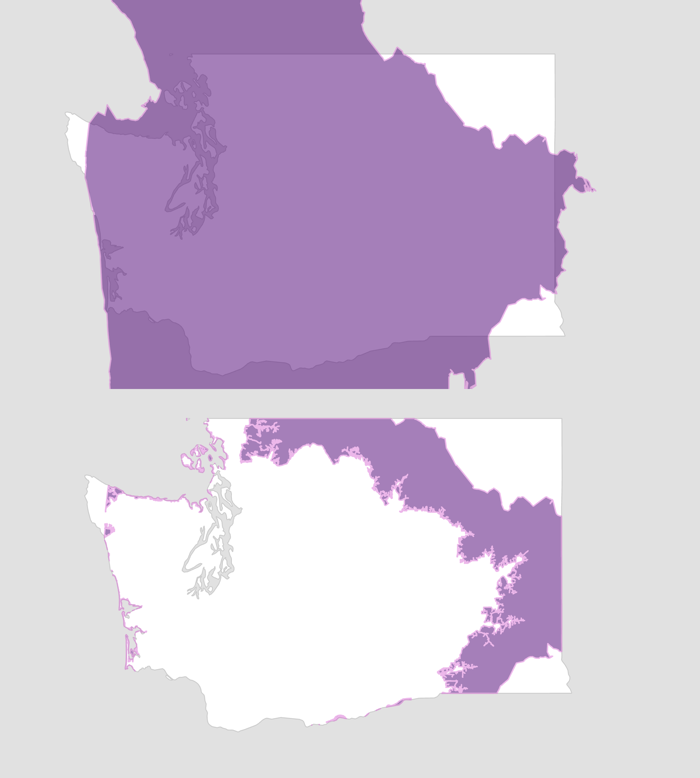
Results of the erase automation.
An example of the automation results. The map on top shows all the areas you can reach within 300 minutes of driving. The bottom image shows only the area that can be reached between 240 and 300 minutes.
-
First maps
We took our calculated areas and made our first attempts at mapping the drive times.
-
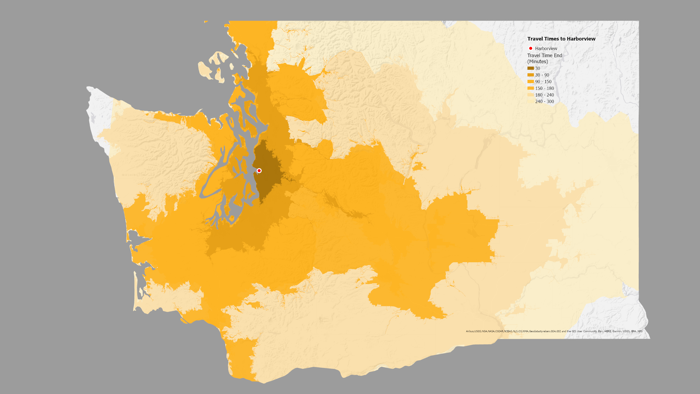
Styling the service areas
We iterated through several styles, trying to find the best way to initialize the data.
-
Updated styling
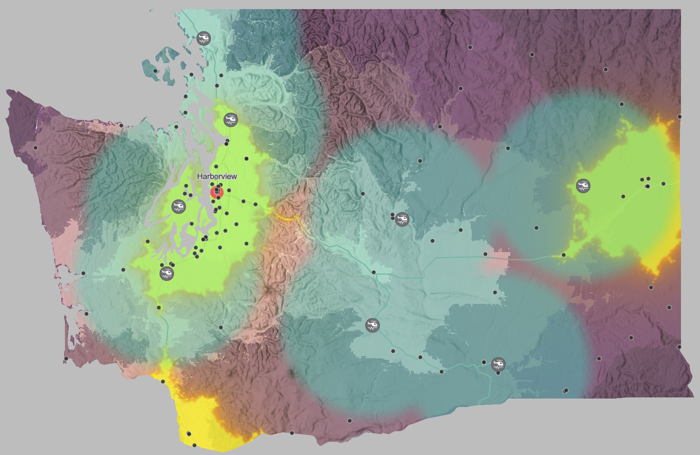
While we liked the aesthetics of early maps, we ultimate decided that the further the distance from Harborview, the darker the band should be. This aligned the design with the results of our data, which showed significantly better outcomes the closer to the hospital you were when dealing with serious head injuries.

-
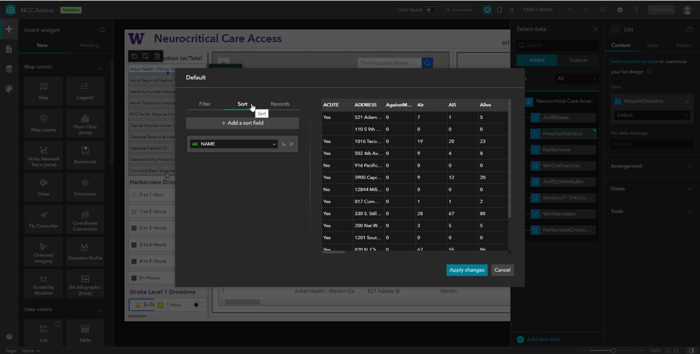
Data Delivery
After exploring many options, including building our own website using ArcGIS API calls, we used ArcGIS Experience Builder to construct our interactive report.
-
Air and Land
Our source data was provided by Harborview and included information about patients arriving by air as well as land. Our report allowed showing these two types of service areas composited, which helped highlighted the importance of air transport for the most distant parts of the state. Harborview is the only level 1 Neurocritical care trauma center for not just Washington but many surrounding states.